

.webp)

USA Rent Prices City by City
Zumper has released its latest rent price report (January 2024) and it shows rents continuing to flatten in most US cities.
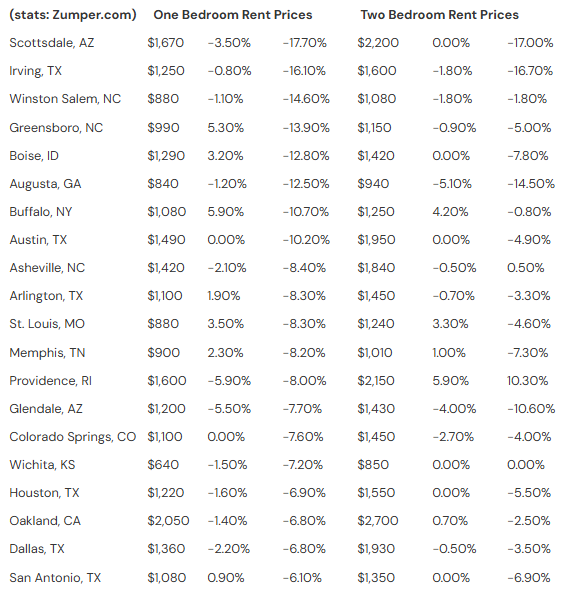
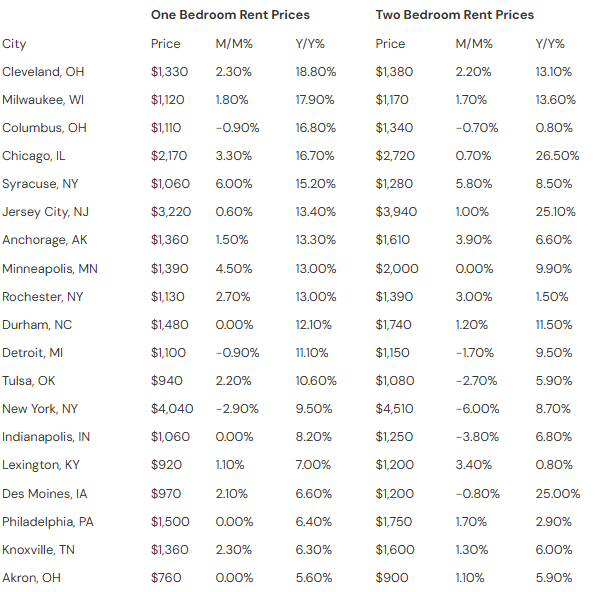
Rents in southern cities are falling while rising strongly in some Northern cities. Year over year, rent prices in Cleveland (+18.8%), Milwaukee (+17.9%), Columbus (+16.8%) and Chicago (+16.7%) are all up by double digits. Cities marked by falling rent prices include: Scottsdale (-17.7%), Irving TX (-16.1%), Winston Salem (-14.6%), Greensboro (-13.9%), and Augusta (-12.6%).
The reason for the higher rates in the Northeast is believed to be due to less construction in the region. NIMBYism, aging renters, and worse-performing economies in the region may have discouraged new residential development.
A Good Year for Renters?
In their report, Zumper noted that it should be a good year for renters with all the new supply that’s hit the market, with more to come in 2024. 10,000 properties listed on Zumper are offering concessions or discounts. For southern landlords, 2024 may be a year of increased marketing and advertising, and efforts to keep tenants leased at current rent levels.
Will rent prices fall in 2024 is the burning question for renters and landlords as they make their plan in a transitional year.
Zumper CEO Anthemos Georgiades said “We’re seeing supply and demand switch places in real time. Pandemic-fueled migrations have slowed just as new multifamily buildings are coming online in many markets. Renters have more leverage right now than any time in recent memory; now is the time to renegotiate existing leases or score a deal on a new apartment.”
As mortgage rates ease, more renters will be seeking to buy a home which could further soften the rental market.
Median Asking Remain at Record Highs
Zumpers CEO Anthemos Georgiades says that year-over-year decreases are likely, “If the current pattern continues, we’ll likely see negative year-over-year growth by the end of winter.”
Zumper’s chart shows the impact of rocketing rents is subsiding, which should be good for the FEDs and the awaiting economy.
Rent prices vs CPI. Screenshot courtesy of Zumper.
Major Metros with Largest Year over Year Rent Drops on 1 Bedroom Units
(stats: Zumper.com) One Bedroom Rent Prices Two Bedroom Rent Prices
Census Housing Starts/Permits
Although housing completions have risen, new construction permits and starts are dropping. It’s not as an inviting climate to builders to expose themselves to FED uncertainty and an economic downturn. Fewer units available however, should help to keep rent prices from plummeting. According to Census.gov, 1,469,800 housing units were authorized by building permits in 2023 which is a drop of 11.7% vs 2022’s total of 1,665,100. Housing starts dropped 9% vs 2022.
RedFin Rent Price Report for October 2023
The Zumper predictions are borne out by the latest report from Redfin. In their most recent December report they found asking rents declining. The Rental vacancy rate rose to 6.6%.
The median U.S. asking rent fell 0.8% year over year in December, for the 3rd straight month to $1,964. November’s decline in prices for -2.1% after and a 0.3% dip in October. These are the most significant drops in 3 years.
Apartment construction is undergoing a steep decline, and that could regenerate housing shortages for 2024/2025.
Redfin’s latest report for October shows the median asking rent in the West fell 1.5% to $2,392. In the South, they fell 0.2% to $1,642. Asking rents grew 4.1% to $1,430 in the Midwest while in the Northeast, they rose 3% to $2,463 per month.
Nashville, New Jersey, Atlanta, Denver, and Austin all suffered deterioration in their rental sectors. However, Nashville enjoyed a huge surge of newly constructed apartment supply, and that supply will be occupied soon enough. The quality of life in Nashville can’t be discounted as a drawing factor. It’s a city in growth and is cited as a city that will become a national leader, among other cities in the Sunbelt. Deteriorating fiscal conditions in northern cities and states are a concern for landlords. However, New York City prices are among the fastest growing in the nation.
And Redfin reports these highest rent increases in major metros:
- Raleigh, NC (16.6%)
- Cleveland, OH (15.3%)
- Charlotte, NC (13%)
- Indianapolis, IN (10.5%)
- Nashville, TN (9.6%)
- Columbus, OH (9.4%)
- Kansas City, MO (8.1%)
- Riverside, CA (7.2%)
- Denver, CO (7%)
- St. Louis, MO (4.2%)
Highest Rent Prices City by City (courtesy of Zumper)When Will Rent Prices Fall?
As the charts revealed, the home-buying market is being decimated, resulting in more commitment to the rental market by renters and also investors.
It’s difficult to forecast home prices throughout the next 5 years, yet with home construction down, inflation high, and American savings accounts in a strong position, with good employment outlooks, there might be good pressure for rent price rises.
The rental property market looks promising resulting in continuous demand for property management software, property management services, and rental units themselves.
Of recent, the number of renters making rent payments on time has decreased slightly, but overall renters appear to be taking their rent payment responsibilities seriously.
What Causes Rent Prices to Rise?
The key drivers of higher rent prices are:
- high real estate prices
- supply still low relative to demand
- poor commitment by local, state and Federal governments to housing growth and affordability
- intense demand for rentals
- employment picture better in some cities
- low vacancy rates (few are moving, low churn)
- migration out of big cities and out of pandemic destinations
- high employment (only in some cities)
- reduced new apartment or house construction
- local building regulations reduce new rental unit development
- NIMBY action at local level prevents development of multifamily buildings
- high construction costs for multifamily developments and apartment buildings
- investor expectations of high returns
- younger renter demographics (Millennials who can’t afford to buy will rent instead, and fast rising numbers of Gen Z’s)
Additionally, the residential housing market has moved to single-family home ownership rather than multifamily rental construction according to the latest report from multifamily executive.
Apartment construction was brisk back in 2017. However, since then construction rates have plummeted despite low financing rates, improving economy and rising demand. Although the Realpage graphic below doesn’t show the last 3 quarters, we can forecast the new builds being markedly lower. As the economy passes the pandemic period, we can shortages causing upward pressure on apartment rental prices in 2021.
Housing Supply Declining
NMHC, in its recent report predicts demographic growth is expected to generate demand for another 3.7 million new rental properties with 5 or more units through 2035. Construction was strong this year with builder confidence up, the FED rate is expected to stay high in 2024 due to persistent inflation, and FED tightening will reduce credit for small builders.
A Better Property Management Solution
Why not check out a simple property management software solution for investors and apartment management pros having portfolios of 5 to 500 units.
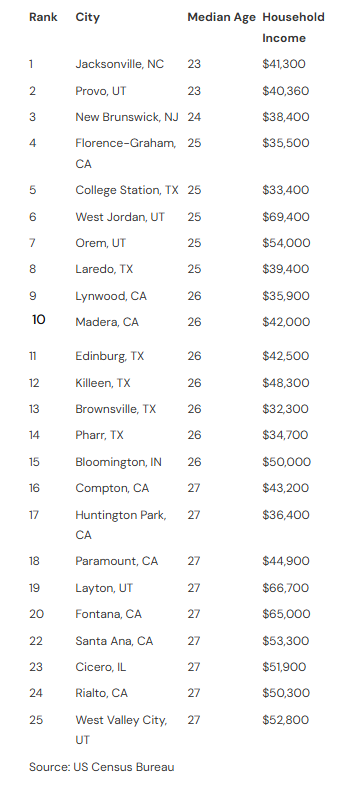
Which Cities will Have the Youngest Population of Renters?
As this chart shows, cities with the youngest renters have the most potential renters. However, average household income and apartment property prices will determine whether they’re a good bet for the next 5 to ten years for investors. Texas, Utah, and California are the most youthful states.
The Best Apartment Management Software
For landlords with 100 t0 5,000+ properties, ManageCasa’s all-in-one, simplified property management software bring impressive capabilities and management efficiency — which creates the profitability you’re hoping for.
Speak to our sales about ManageCasa, a comprehensive property management platform to maximize your rent revenues and minimize your rental expenses.
Contact us at: 800 998 6627.